Chapter 4, ACCS Strategic Plan
This text-only version is offered as a more accessible alternative to this PDF document: Arlington County Commuter Services Transportation Demand Management Plan (PDF, 3.85 MB).
Target Markets and Customers
ACCS helps people find means of transportation other than single-occupancy vehicles (SOV). Operating with finite resources requires focusing on specific target markets and customers to ensure that resources are utilized efficiently and effectively to meet the needs of select commuters and travelers. This section identifies the program's target markets and explains the reasons for their selection.
Methodology
Target markets and customers were identified by considering several key information sources and inputs, including ACCS service area demographics, an equity analysis conducted specifically for this Strategic Plan, and feedback received during stakeholder focus groups.
As outlined in Chapter 2, Arlington is a diverse, fast-growing jurisdiction with a younger median age and higher proportion of working-age residents compared to the rest of Virginia. It also has both substantial residential and commercial density, making it both a popular residential origin and workplace destination within the greater Washington, DC region. While the Commuter Assistance Program will continue to emphasize work commute trips, it will also consider the transportation needs of Arlington residents traveling to places other than work, such as retail and dining locations, doctors' offices, places of worship, and special events.
The selection of target markets and customers was also informed by an equity analysis conducted for this Strategic Plan, which uses Arlington-specific Equity Emphasis Areas to highlight parts of the County that should be considered for deploying TDM programs targeting historically marginalized groups. The equity analysis is outlined in further detail in a later section of this chapter.
Finally, the selection of target markets and customers was informed by ACCS's updated vision and mission, which were developed as part of a stakeholder engagement process conducted with ACCS staff, contractors, and external stakeholders, and documented in Chapter 3.
Target Markets
ACCS determined two overall markets to which it will target its efforts and expenditures in implementing this CAP:
-
Recurring trips, including anyone traveling to work or school on a regularly scheduled basis (regardless of time of day).
-
Non-recurring trips, including anyone traveling for any reason other than a recurring trip (e.g., shopping, doctor, dining, worship, special events).
These markets were selected to maximize trip reduction results in the most cost-effective manner, given ACCS's finite funding and resources. These markets are further broken down into subgroups of target customers in Section 4.3.
Target Customers
This section further identifies the program's target customers within the target markets to assist ACCS in developing an effective strategy for increasing use of non-SOV modes,
RECURRING TRIPS
This target market includes anyone traveling to work or school on a regularly scheduled basis, regardless of the time of day. This market is further subdivided into the customer and trip types outlined below. Data within this section are drawn from and cited in Chapter 2 of this plan.
Travelers with Recurring Trips to/from Large Generators/Attractors in Arlington
Commuters to Large Employers in Arlington
Arlington County is home to 9,648 employers, 78 percent of which have fewer than 10 employees and 95 percent of which have fewer than 50 employees. This leaves nearly 500 employers with more than 50 employees, who are good candidates for TDM programs due to the large pool of employees they have access to and their administrative capacity to manage TDM programs. This customer category includes both Arlington residents and non- residents, as the focus of TDM programming for these commuters would occur at the workplace. Commuters at the 750 companies with at least 20 employees but fewer than 50 (another 8% of employers in the County) would be secondary customers.
Low-Wage Earning Workers at Large Employers in Arlington
This customer group is comprised of low-wage earning workers at large employers in Arlington with a substantial number of low-wage workers. This customer group was identified in order to pursue an equity-focused rebalancing of employer-based TDM programming. As noted in the Equity Analysis, Arlington's employer TDM programming has historically been focused on higher earning office workers. Targeting employees of retail and service-oriented establishments is likelier to include low-income and minority populations as compared to office employers. Dining, retail, and hotel employees are ideal targets for employer-based outreach, as their employers will have resources for mass communication with employees, as well as the ability to replicate efforts at multiple locations.
Multifamily Housing Residents in Arlington's Equity Emphasis Areas Making Recurring Trips
This customer group is comprised of residents of multifamily residential buildings or developments. While residents of multifamily residential properties have long been a focus of ACCS and will continue to be, this target customer group is being refined to expand to and focus on residents of multifamily buildings located in Arlington's Equity Emphasis Areas (defined in the equity analysis) making recurring trips to work or school.
This customer group was identified to pursue an equity-focused rebalancing of residential TDM programming. Arlington's Equity Emphasis Areas are mostly located outside of the Metrorail corridors; multifamily housing within Metrorail corridors tend to be newer and more expensive, and residential TDM programs have been historically focused in these areas due to zoning requirements for new developments. Targeting residents of older multifamily residential buildings outside of Metrorail corridors and in Equity Emphasis Areas is likelier to include low-income and minority populations, as illustrated on the American Community Survey (ACS)- based income and racial minority maps on Figure 24 and Figure 25.33
Travelers with Recurring Trips Going into or out of Arlington
Arlington Resident Commuters to Other Northern Virginia Jurisdictions
Other Northern Virginia jurisdictions are the commute destination of 35 percent of Arlington residents. This customer category would be a target for residential TDM programming, particularly in areas of Arlington from which there are good non-driving commute options to other Northern Virginia jurisdictions. Areas most suitable for residential outreach would be the Route 1 and Rosslyn-Ballston corridors, and Shirlington, all of which have high levels of transit access conducive to encouraging its use. While residents in other parts of the county traveling to other Northern Virginia jurisdictions could use other modes, such as carpooling or vanpooling, that outreach might be better suited to be conducted by the TDM program of the destination jurisdiction.
Alongside promotion of all applicable ACCS programs, outreach to these customers should focus on the non-SOV modes they would most likely use for commuting to other Northern Virginia jurisdictions, namely:
-
Metrorail and Metrobus.
-
Other Virginia-based transit services connecting in and serving Arlington, such as DASH, Fairfax Connector, Loudoun County Transit, OmniRide, and Virginia Railway Express.
-
Carpooling/vanpooling.
-
Major off-street bicycle trails connecting Arlington with other Northern Virginia jurisdictions, such as the Washington and Old Dominion Trail, Mount Vernon Trail, and Four Mile Run Trail.
Arlington Resident Commuters to the District of Columbia, Montgomery County, and Prince George's County
The District of Columbia, Montgomery County, Maryland, and Prince George's County, Maryland combined are the commute destination of 37 percent of Arlington residents. This customer category would be a target for residential TDM programming, particularly in areas of Arlington from which there are good non-driving commute options to the District of Columbia and Maryland. Like the category of customers traveling to other Northern Virginia jurisdictions, this customer category's most suitable areas for residential outreach would be the Route 1 and Rosslyn-Ballston corridors, and Shirlington, all of which have high levels of transit access conducive to encouraging its use. This is particularly true for commuters to Maryland, whose job location once they get to a rail station might still require another transit connection (there is, at present, no bus service between Arlington County and Maryland). While residents in other parts of the county traveling to DC and Maryland could use other modes, such as carpooling or vanpooling, that outreach might be better suited to be conducted by the TDM program of the destination jurisdiction.
Alongside promotion of all applicable ACCS programs, outreach to these customers should focus on the non-SOV modes they would most likely use for commuting to the District of Columbia and Maryland, namely:
-
Metrorail, Metrobus, Ride On (Montgomery County), The Bus (Prince George's County), and MARC Commuter Rail.
33 Source: American Community Survey (ACS) Five-Year Estimates (2021) and One-Year Estimates (2022)
-
Carpooling.
-
Major off-street bicycle trails connecting with river crossings to the District of Columbia (and by extension, Maryland), such as the Mount Vernon Trail and Custis Trail.
Travelers with Recurring Trips during Second or Third Shift, or on Weekends
This group includes travelers making recurring trips both within Arlington and to/from outside Arlington, with a focus on non-traditional commute times like second or third shifts (approximately 5:00 p.m. – 1:00 a.m. and 12:00 – 8:00 a.m., respectively) and weekends. This group is likely to have substantial representation from residents of Equity Emphasis Areas, many of whom work nights and/or weekends. Messaging for this group will include details about available transit service, which will be generally more limited than weekday and/or peak hour service, as well as carpool/vanpool options.
NON-RECURRING TRIPS
This target market includes anyone traveling for any reason other than a recurring trip (with recurring trip defined as trips to work or school on a regularly scheduled basis, regardless of the time of day). This market is further subdivided into the following customer and trip types.
Arlington Residents' Individual Trips within Arlington
This category includes Arlington residents' trips to non-recurring, but everyday destinations like doctor appointments, grocery shopping, libraries, and restaurants. These destinations are likely to be located within or close to Arlington and will therefore be shorter trips.
Arlington Residents Traveling to Elsewhere in the Region, and People from Elsewhere in the Region Traveling to Arlington
This category includes interjurisdictional trips to non-recurring and more unique destinations both inside and outside Arlington like sporting events, museums, cultural sites, and other one- time destinations such as marathons/races, National Mall events, and conventions. These customers would be the target of marketing and outreach to promote modes suited to longer-distance travel and for information regarding the scarcity and high cost of parking.
Multifamily Housing Residents in Arlington Equity Emphasis Areas Making Non-Recurring Trips
This customer group is comprised of residents of multifamily residential buildings or developments in Arlington's Equity Emphasis Areas (as defined in the equity analysis) making non-recurring trips. This customer group has the same geographic focus as the multifamily housing residents group in the Recurring Trips section, but outreach efforts will be focused on irregular, one-time trips.
Equity Analysis
ARLINGTON'S EQUITY FOCUS
Arlington has identified equity as a central component of its planning efforts. The County adopted an Equity Resolution in 2019 stating its commitments to assessing whether the County's plans and programs exacerbate disparities and establishing equity targets and developing an equity scorecard as part of an Equity Action Plan, along with other equity-focused initiatives.34 As a result of the resolution, the County developed an equity vision through the program Realizing Arlington's Commitment to Equity (RACE). RACE identifies Arlington's county-wide mission for racial equity “to eliminate, reduce and prevent disparities in the County's policies, procedures, practices, engagement and interaction with and service to the community.”35 The County makes this information publicly available on a webpage dedicated to Arlington's racial equity efforts and commitments, including a Racial Equity Action Plan framework, annual reports, a race and ethnicity dashboard, racial history timelines, and other tools and resources.36
Specifically, regarding transportation, Arlington's Vision Zero program is identified as an equity initiative, and “emphasize equity and engagement” is one of the program's core tenets.37 The Vision Zero Action Plan further emphasizes equity in terms of the high correlation between the High-Injury Network (roadways where fatal and serious crashes are concentrated) and Arlington's census tracts with high racial and ethnic diversity.38 These are areas where ACCS's efforts to promote non-driving transportation options can have an impact on equity.
Finally, Arlington Transit's vision is for “a safe, equitable, accessible, reliable, and convenient transportation system that effectively and efficiently sustains the environment, economy, and quality of life in Arlington.”39 Arlington County's FY 2025–2034 Transit Strategic Plan (TSP), adopted in November 2023, also included an equity analysis that identified equity populations, developed a Transit Equity Demand Index, and outlined equity solutions to be incorporated into the TSP.
EQUITY ANALYSIS INTRODUCTION
This equity analysis presents a framework for delivering TDM benefits more equitably throughout Arlington, as well as identifies the locations of equity populations—defined as areas having higher minority and/or low-income populations (consistent with the County's Title VI Program) as well as zero-car households and low-wage jobs—to help further target TDM efforts in the County.
Arlington's Equity Emphasis Areas
The analysis uses Arlington-specific Equity Emphasis Areas to highlight parts of the County that should be considered when deploying TDM programs to historically marginalized groups. An Equity Emphasis Area in Arlington is defined as a Census block group having either or both of the following characteristics:
34 Source: https://arlingtonva.s3.amazonaws.com/wp-content/uploads/sites/21/2020/02/Equity- Resolution-FINAL-09-21-19.pdf
35 https://www.arlingtonva.us/files/sharedassets/public/topics/documents/equity/realizing-arlingtons- commitment-to-equity-annual-report-12-16-22.pdf
36 https://www.arlingtonva.us/Government/Topics/Equity
37 https://www.arlingtonva.us/Government/Programs/Transportation/Vision-Zero
38 Source: https://www.arlingtonva.us/files/sharedassets/public/v/1/transportation/documents/action- plan_revised_draft_v3.pdf
39 Source: https://www.arlingtonva.us/files/sharedassets/public/v/1/commissions/documents/transportation/23_02
-
17.5 percent or more households with median income below $50,000
-
38 percent or more Black, Indigenous, or people of color (BIPOC)
The Equity Emphasis Areas were identified as part of Arlington Transit's Title VI Program developed for the Federal Transit Administration.40 The Title VI Program identified block groups with a Black, Indigenous, or people of color (BIPOC) population of 38.5 percent or more as a minority block group, and low-income block groups are where 17.5 percent or more of households have a median income of $50,000 or less, i.e., less than 50 percent of the Metropolitan Statistical Area (MSA) median household income, adjusted for family size.41 Any block group that meets either or both of these criteria is considered an equity emphasis area by Arlington County's Title VI program and therefore by this plan. Note that these Equity Emphasis Areas are distinct from MWCOG's Equity Emphasis Areas, which are based on income and demographics at the regional level and included relatively few parts of Arlington County.
Role of TDM in Assisting Populations in Equity Emphasis Areas
TDM plays an important role in providing access to jobs, services, healthcare, education, retail, and leisure activities while enhancing sustainability and reducing traffic congestion. If designed intentionally, TDM programs can reduce existing inequities by removing travel- related barriers to jobs and opportunities, specifically by providing more travel mode choices.42 However, access to multimodal travel options has historically been unevenly distributed, reflecting a broader pattern in transportation networks of prioritizing convenience and access for wealthier, often whiter populations, while low-income and racial and ethnic minority groups experience longer, more unpredictable trips and higher exposure to pollution.
Many transportation projects and policies undertaken in the last century have further exacerbated these inequalities. Recently, local and national policies have focused on addressing these historic inequalities. Notable among such policies is Justice40, a Federal Government goal that 40% of the overall benefits of certain Federal investments flow to disadvantaged communities that are marginalized, underserved, and overburdened by pollution.43 ACCS has long focused on initiatives, policies, and programs to bolster equity and equitable access to TDM services in the region. These include engagement of those with limited English proficiency, particularly Spanish speakers, equity programs and policies for Capital Bikeshare and micromobility devices, and Commuter Stores that offer cash-based services for unbanked users.
As noted earlier in this section, Arlington County's CAPSP identifies equity populations as areas that are Arlington County Equity Emphasis Areas as well as those areas with a prevalence of zero-car households and areas with low-wage jobs – and it considers these populations a target market. Specific target customers in these markets listed in the Target Markets section include low-wage earning workers at large employers in Arlington, multifamily housing residents in Arlington's equity emphasis areas making recurring trips, and travelers with recurring trips during second or third shift or weekends. Therefore, looking toward the future of the TDM program in Arlington County, there is a need to more intentionally broaden the focus beyond white-collar workplaces/commute trips and new multifamily residential buildings. TDM programming should also focus outreach on people who work non-standard hours and who live in older multifamily residential buildings, who are more likely to be low-income and/or racial or ethnic minorities.
40 Source: https://www.arlingtontransit.com/sites/art/assets/file/2021_2023_TITLE_VI_REVISED_REPORT_02282022.pdf
41 Median income of the MSA is $117,432, as compared to $128,145 for Arlington County. https://censusreporter.org/profiles/31000US47900-washington-arlington-alexandria-dc-va-md-wv-metro- area/ and https://www.census.gov/quickfacts/arlingtoncountyvirginia)
42 Source: https://ops.fhwa.dot.gov/plan4ops/trans_demand.htm
43 https://www.whitehouse.gov/environmentaljustice/justice40/
Facilitating easier access to non-single occupancy vehicle (SOV) modes of travel for equity populations is also a strategy for ameliorating some of the aforementioned racial and economic disparities in Arlington, as low-income and racial and ethnic minorities are more likely to live further from major job/activity centers and transit centers and therefore have fewer options to choose when making a trip. Furthermore, based on the Vision Zero Equity Analysis, people living in those areas of Arlington that have higher racial minority and low- income populations are more likely to experience fatal or serious injury crashes.44 Because these same populations are also more likely to not own a car,45 facilitating easy access to non- SOV travel modes is an important equity strategy not only for access to opportunity, but for safety.
EQUITY EVALUATION AND IMPACTS
The remainder of this section is made up of three parts: a short demographic overview of the region and the effects of the COVID-19 pandemic on populations and travel patterns, a high- level overview of equity considerations in TDM, and the identification of potentially underserved populations where additional TDM efforts in Arlington should be focused.
Demographic and Travel Trends
As noted in Chapter 2, Arlington has a unique demographic profile compared to the rest of Virginia. It has a faster-growing population, a lower median age, and a higher ratio of working- age residents. Arlington's population is approximately 60 percent white non-Hispanic/Latino, 17 percent Hispanic/Latino, 11 percent Asian non-Hispanic/Latino, and nine percent Black non-Hispanic/Latino (Figure 16). Seventeen percent of Arlington's full-time, year-round workers earn less than $50,000 a year, while 37 percent earn between $50,000 and $100,000, and 46 percent earn over $100,000 (Figure 17). Additionally, nearly 29 percent of Arlington residents speak a language other than English at home, while 30 percent speak English less than very well.46 A TDM equity analysis must consider where these socioeconomic groups live, work, and travel in Arlington County.
44 https://www.arlingtonva.us/files/sharedassets/public/v/1/transportation/documents/action- plan_revised_draft_v3.pdf
45 https://www.sciencedirect.com/science/article/pii/S1361920923000196?via%3Dihub
46 US Census Bureau, American Community Survey (ACS) Five-Year Estimates (2021), Table S1601 https://data.census.gov/table/ACSST5Y2021.S1601?q=language%20spoken%20at%20home&g=050XX00 US51013
Figure 16: Race and Ethnicity in Arlington

Figure 17: Individual Earnings of Full-Time, Year-Round Workers in Arlington

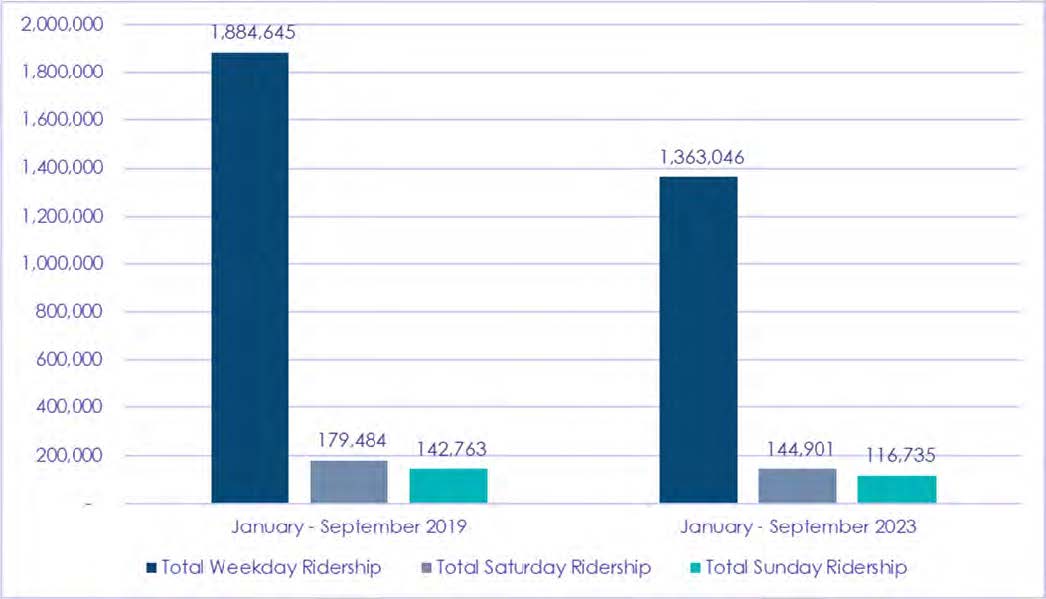
The COVID-19 pandemic had substantial adverse effects on transit operations at the county and regional levels. Arlington, like much of the country, has not seen transit ridership recover to pre-pandemic levels. Arlington's Metrorail stations' average daily entries for 2023 was 45 percent lower than 2019 average daily entries, while annual ridership of Metrobus routes that serve Arlington47 from January through September of 2023 was 24 percent lower than in the same period of 2019, as seen in Figure 18 and Figure 19.48
47 This includes ridership of the entire routes, including the portions of the routes that travel outside Arlington.
48 https://www.wmata.com/initiatives/ridership-portal/, accessed November 2023
Figure 18: Average Daily Entries at Arlington Metrorail Stations (2017-2023)

Figure 19: Ridership of Metrobus Routes Serving Arlington (Jan-Sep 2019 and Jan-Sept 2023)

Similarly, ART's total ridership for January through September of 2023 was 26 percent lower than the same time period in 2019 (Figure 20).49 The impact of continued reduced ridership on systems that had already been facing fiscal constraints is a major financial concern for transit providers.
49 https://www.arlingtontransit.com/about/monthly-service-ridership-reports/, accessed November 2023
Figure 20: ART Ridership (Jan-Sep 2019 and Jan-Sept 2023)

Transit demand by time of day and day of week has also shifted since the pandemic. Several transit agencies across the country are reporting that off-peak service demand was less impacted by pandemic-driven ridership changes than peak-period service.50 Some of these changes can be attributed to a long-term trend toward telework for office workers but continued reliance on transit for service workers. This national trend is also present in Arlington and the Washington, DC region. Arlington's Metrorail stations' average weekday peak hour entries for January through September of 2023 were 54 percent lower than the 2019 average weekday peak hour entries, but only 29 percent lower for weekday off-peak trips and six percent lower for weekend trips (Figure 21).
Figure 21: Arlington Metrorail Weekday Average Daily Entries (2019 and Jan-Sep 2023)

50 https://nap.nationalacademies.org/catalog/26487/assessing-equity-and-identifying-impacts- associated-with-bus-network-redesigns
Similarly, systemwide Metrobus average weekday peak hour ridership for January through September of 2023 was 47 percent lower than the 2019 average weekday peak hour ridership, but only 37 percent lower for weekday off-peak trips and 26 percent lower for weekend trips (Figure 22).51
Figure 22: Systemwide Metrobus Weekday Average Daily Ridership (2019 and 2023)

Finally, ART's total weekday ridership for January through September of 2023 was 28 percent lower than the same months in 2019, but only 19 percent lower for Saturday trips and 18 percent lower for Sunday trips (Figure 23).52
51 https://www.wmata.com/initiatives/ridership-portal/, accessed November 2023
52 https://www.arlingtontransit.com/about/monthly-service-ridership-reports/, accessed November 2023
Figure 23: ART Total Ridership by Day of Week (Jan-Sep 2019 & Jan-Sep 2023)
Transportation Equity Considerations
Impact of Transportation Emissions on Vulnerable Communities
One of the goals of ACCS is to increase the share of all Arlington trips taken by transit, walking, biking/scootering, and carpooling/vanpooling, which in turn results in a reduction in greenhouse gas emissions (GHG) emissions and local tailpipe pollutants, which include carbon dioxide (CO2), nitrogen oxides (NOx), hydrocarbons (HC), sulfur dioxide (SO2), particulate matter (PM10), and ozone (O3). In 2021, transportation emissions accounted for 28.5 percent of the United States' total GHG emissions. Of that, 81 percent of emissions came from cars and personal trucks, with the remainder from other transportation sources.53 Although climate change is often cited as the main impetus for the reduction of GHG emissions, researchers have found that socially vulnerable populations—defined by income, educational attainment, race, and ethnicity, and age—are projected to face more severe harm from climate change.54
Many BIPOC populations live in communities bisected by highways and interstates and are directly exposed to harmful tailpipe pollutants such as carbon monoxide, oxides of nitrogen, black carbon, and particulate matter. Research suggests that populations that live near roadways with heavy traffic experience elevated risk for development of asthma and reduced lung function in children.55 As an urban county, there are many surface level, high volume arterial roads—in addition to state and interstate highways—which contribute to degraded air quality throughout the County.
53 Source: https://www.epa.gov/system/files/documents/2023-04/US-GHG-Inventory-2023-Main-Text.pdf
54 Source: https://www.epa.gov/newsreleases/epa-report-shows-disproportionate-impacts-climate- change-socially-vulnerable
Arlington County has a troubling past regarding transportation infrastructure and its effects on marginalized communities. In the 1930s, several transportation-related projects exacerbated segregation in the County: the construction of Route 50 in 1931, also known as Arlington's “segregation wall,” created a “physical and social divide between north and south Arlington.”56 The following year, the streetcar line that connected Washington, DC and Mount Vernon in Alexandria was replaced by the George Washington Memorial Parkway in favor of automobile owners who were, at the time, considerably wealthier. The effects of these infrastructure projects remain today; the communities that live along Route 50 (or Arlington Boulevard as it is known today) have been identified as Equity Emphasis Areas by Arlington County and as disadvantaged communities under Justice40. These communities are bearing the health burdens of noise and additional pollution that come with living next to the highway, almost 100 years since its construction.
The same can be said for many of the communities along I-395 in south and east Arlington. Many Black residents in Queen City and East Arlington were displaced using eminent domain to make way for the development of the Pentagon, Ronald Reagan Washington National Airport, and I-395, which provided vehicular access to the new developments. The communities that remain along I-395 today, many of which are Arlington Equity Emphasis Areas, suffer the adverse impacts of transportation-related noise and pollution due to their location near the Interstate.
TDM strategies that reduce single occupancy vehicle travel and congestion can mitigate the detrimental effects that climate change and greenhouse gas emissions have on vulnerable communities. Although these strategies only play a part in the reduction of emissions, they can produce changes that reduce the risk of health issues for people of color and low-income populations in Arlington that have been historically adversely affected by large roadways cutting through their communities.
Shift Work and Non-Standard Hours
Many equity issues in transportation stem from the development of highways and the dependence on automobiles. Public transit, carpooling/vanpooling, and other forms of alternative transportation follow development or planning patterns that can further aggravate equity issues. Historically, many transit systems were planned to connect suburban residents to downtown job centers and to prioritize service at morning and afternoon peak hours. While there are many benefits to providing peak service at these hours, such as the reduction of congestion, service for 9-to-5 jobs in the downtown has often been prioritized over jobs that require non-standard hours or shift work.
Arlington County's FY2025-2034 Transit Strategic Plan (TSP), adopted in November 2023, included a goal of deploying infrastructure and services equitably, with specific objectives that included identifying current transit service disparities for low-income and minority populations and ensuring that transit amenities and service provide a positive impact on underserved communities. WMATA's ongoing Better Bus Network Redesign project, with anticipated completion in 2024 and implementation thereafter, is likewise prioritizing equity in developing updated Metrobus routes and level of service by time of day and day of week.
56 Source: Arlington Racial History Timeline. Retrieved from: https://sway.cloud.microsoft/LDWSWfLwS49GT0Af?ref=Link
57 Source: https://www.apta.com/wp-content/uploads/APTA_Late-Shift_Report.pdf
Cost as a Factor in Mode Shift
A key equity consideration in TDM planning from an equity perspective is the impacts of costs on travel mode shift for different income groups. For example, low-income individuals have reported a higher likelihood of switching to transit, walking, and bicycling in response to rising gas prices than middle- and high-income individuals, even as they still evaluate both time and money costs of each available mode.58
In addition to gas prices, the high cost of car ownership—purchase, maintenance, insurance, and parking—makes TDM services more critical for equity populations. Because Arlington is a dense, urban jurisdiction with a wide variety of non-vehicular travel options only highlights the importance of making sure low-income individuals have access to these modes through TDM services tailored to them.
Distribution of Services
An equity-informed TDM approach requires ensuring that TDM services are distributed with a particular focus on equity populations. This applies both to direct TDM programming and marketing and to coordination with other County departments on providing non-SOV travel options to and within areas with greater equity needs.
Arlington's employer- and residential-focused TDM efforts have historically focused primarily on white-collar office workers whose employers offer transit benefits, and on new multifamily residential buildings whose TDM programs are tied to their zoning approvals. While this focus will continue, going forward, TDM employer and residential programming should also include a focus on retail and service-oriented employers, as well as older multifamily residential buildings, as these employers and residential buildings are likelier to include low-income and minority populations.
TDM marketing and promotions should also be planned with equity in mind, including media campaigns and easily accessible online information advertising programs oriented toward low-income individuals. TDM programming should also allow easier access to alternative modes such as discounted/reduced price bikeshare, shared scooters, and transit fares for low- income individuals. TDM services should also coordinate with other County agencies to continue ensuring an equitable distribution of micromobility devices,59 and advocate for improved transit, bicycle, and pedestrian facilities in areas with greater equity needs.
Identifying Potentially Underserved Populations
This section provides more detail about how equity populations are defined and identifies where areas well-suited for equity-focused TDM engagement are located within Arlington County. It includes an analysis of equity populations in the county, as defined by several demographic factors. These factors are each presented with a short narrative and map. Each map also includes an overlay of Arlington's Equity Emphasis Areas, as defined earlier in this section.
58 Source: https://transweb.sjsu.edu/sites/default/files/2806_10-02.pdf
59 Source: https://www.arlingtonva.us/Government/Programs/Transportation/Scooters-and-Dockless- Bikeshare
Minority Populations
Figure 24 shows the geographic distribution of Arlington's racial and ethnic minorities by census block group. Racial and ethnic minority populations are concentrated in the southern portion of the County, particularly along Columbia Pike. 60 High concentrations of racial and ethnic minorities are also generally aligned with Arlington's Equity Emphasis Areas. Arlington's Equity Emphasis Areas are partially defined by Arlington Transit's Title VI requirements and guidelines, which define block groups with a Black, Indigenous, or people of color (BIPOC) population of 38.5 percent or more as a minority block group.
Figure 24: Minority Population

60 Source: American Community Survey (ACS) Five-Year Estimates (2021) and One-Year Estimates (2022)
Low-Income Populations
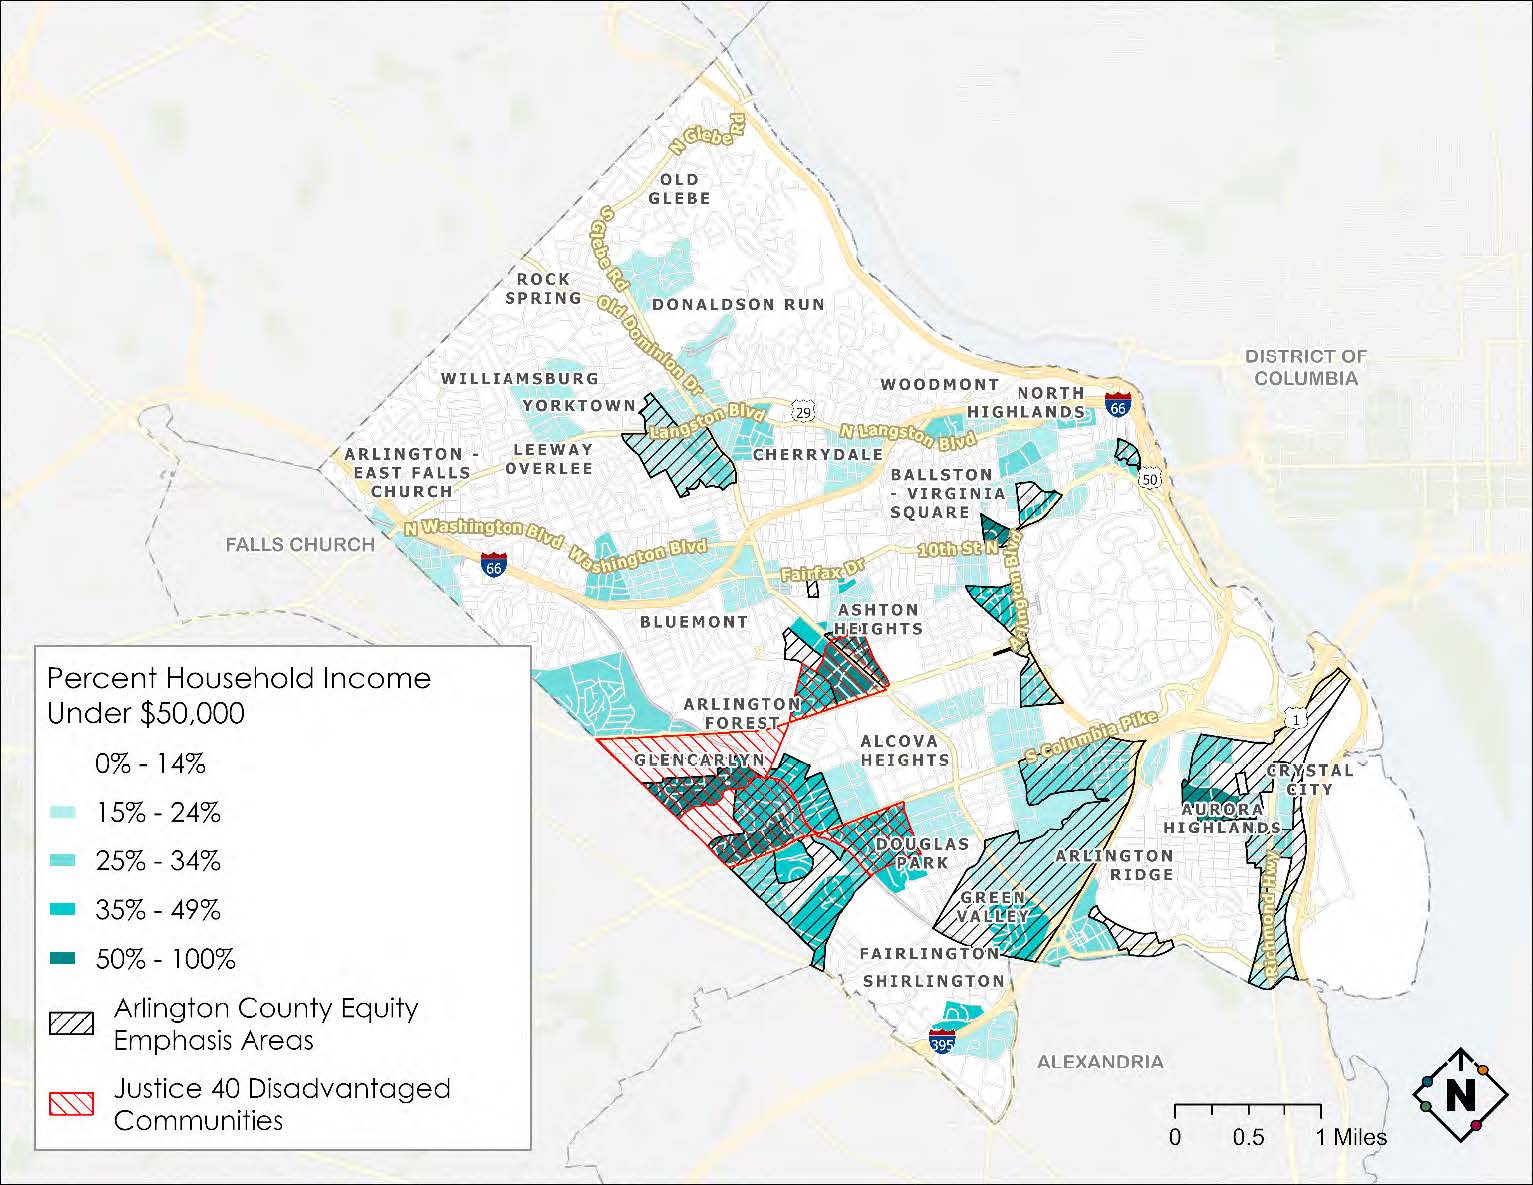
Figure 25 shows the geographic distribution of Arlington's low-income households by census block group (block groups with more than 17.5 percent of households earning less than
$50,000 per year, adjusted for family size). Low-income households are distributed similarly to racial and ethnic minority populations, with high concentrations in the southern portion of the County, particularly along Columbia Pike. High concentrations of low-income households are also generally aligned with Arlington's Equity Emphasis Areas.61
Figure 25: Low-Income Population
Zero-Car Households
Figure 26 shows the geographic distribution of Arlington's households that do not own a car. These households are concentrated along Columbia Pike, Glebe Road, the Rosslyn-Ballston corridor, as well as in Pentagon City and Crystal City. 62 While some of these households may not own a car due to financial constraints, others are likely higher-income households in the County's denser, transit-accessible neighborhoods who choose not to own a car as a lifestyle choice. High concentrations of zero-car households are somewhat aligned with Arlington's Equity Emphasis Areas, but only to a limited degree.
Figure 26: Zero-Car Households

Low-Wage Job Concentration
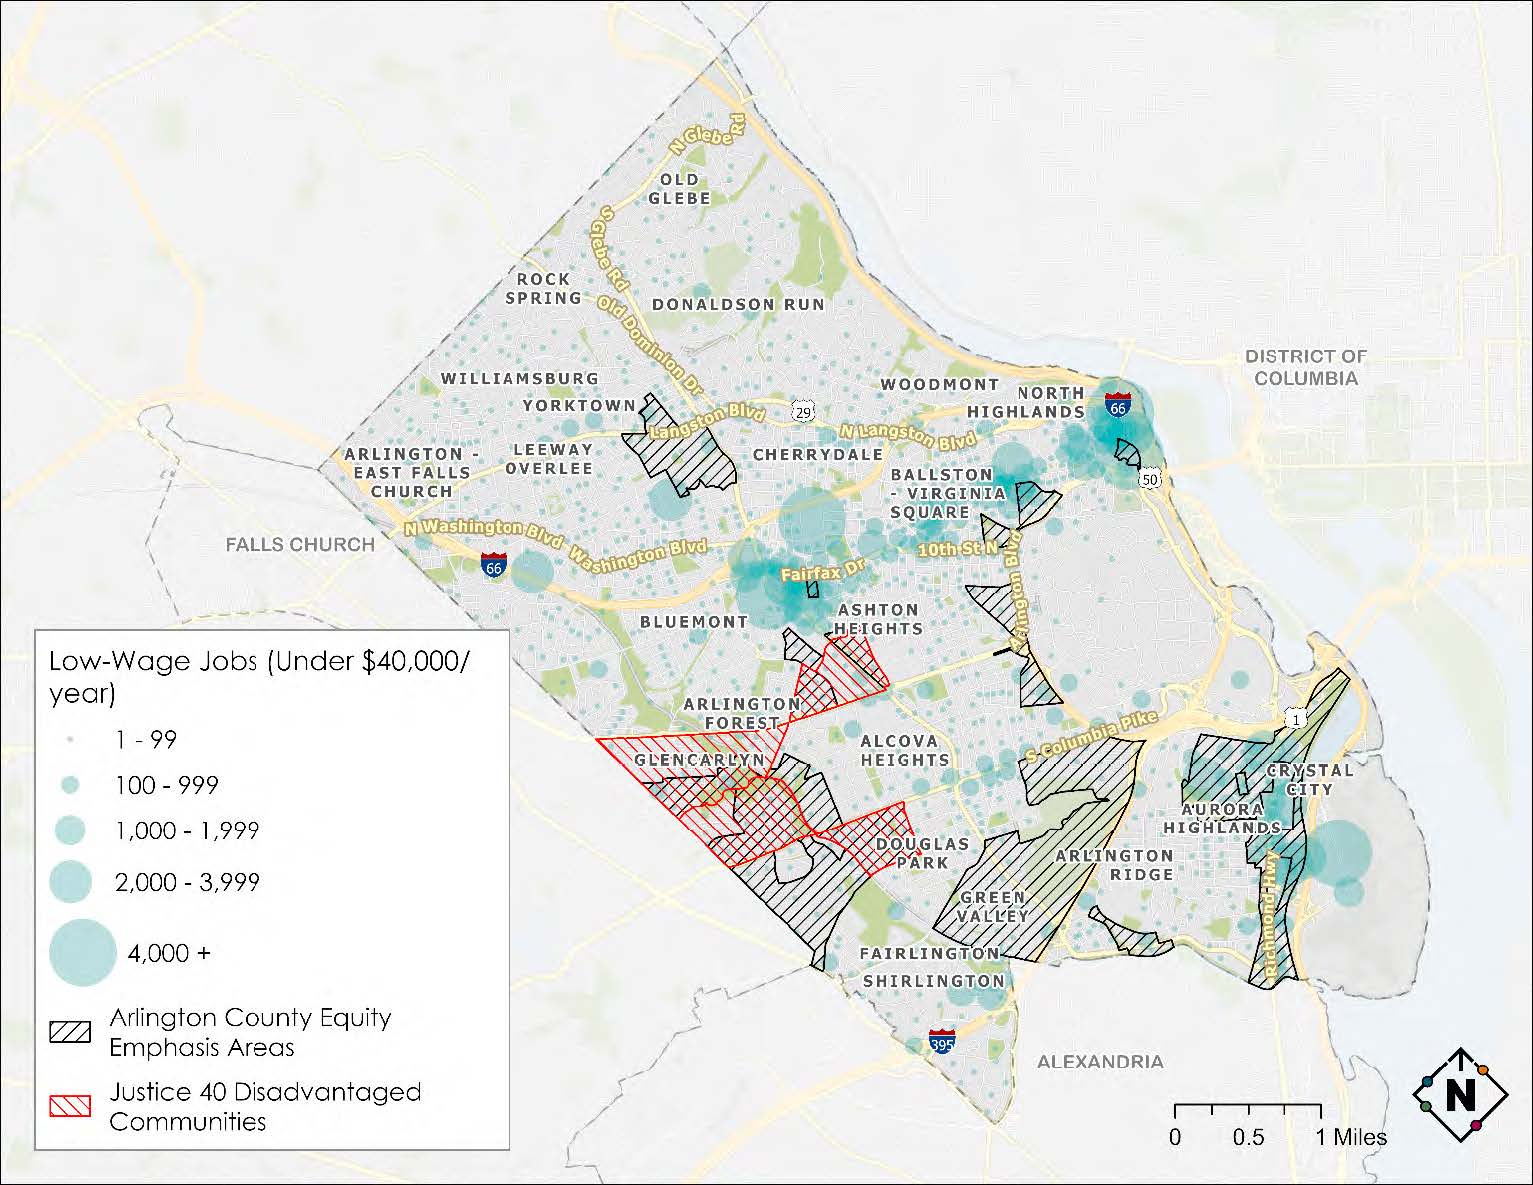
Figure 27 shows the geographic distribution of Arlington's low-wage jobs, defined as jobs paying under $40,000 per year. Low-wage jobs are mostly concentrated along the Rosslyn- Ballston corridor and Pentagon City and Crystal City, and to a smaller degree along Columbia Pike and Langston Boulevard, and in Shirlington. 63 Notably, there is little correlation between low-wage jobs and Equity Emphasis Areas, highlighting the need for reliable, affordable non- SOV travel options connecting workers from Arlington's Equity Emphasis areas—as well as workers from outside the County—to these areas with high concentrations of low-wage jobs.
Figure 27: Low-Wage Job Concentration
Gap Analysis and Needs Assessment
COMMUTER TRENDS AND PATTERNS
As outlined in Chapter 2, Arlington's existing commute trip patterns include three main groups:
-
Approximately 89,000 people who live in Arlington but work outside it, for whom the most common commute destination is the District of Columbia.
-
Approximately 135,000 people who work in Arlington but live outside it, for whom the most common commute origin is Fairfax County.
-
Approximately 23,000 people who both live and work in Arlington.
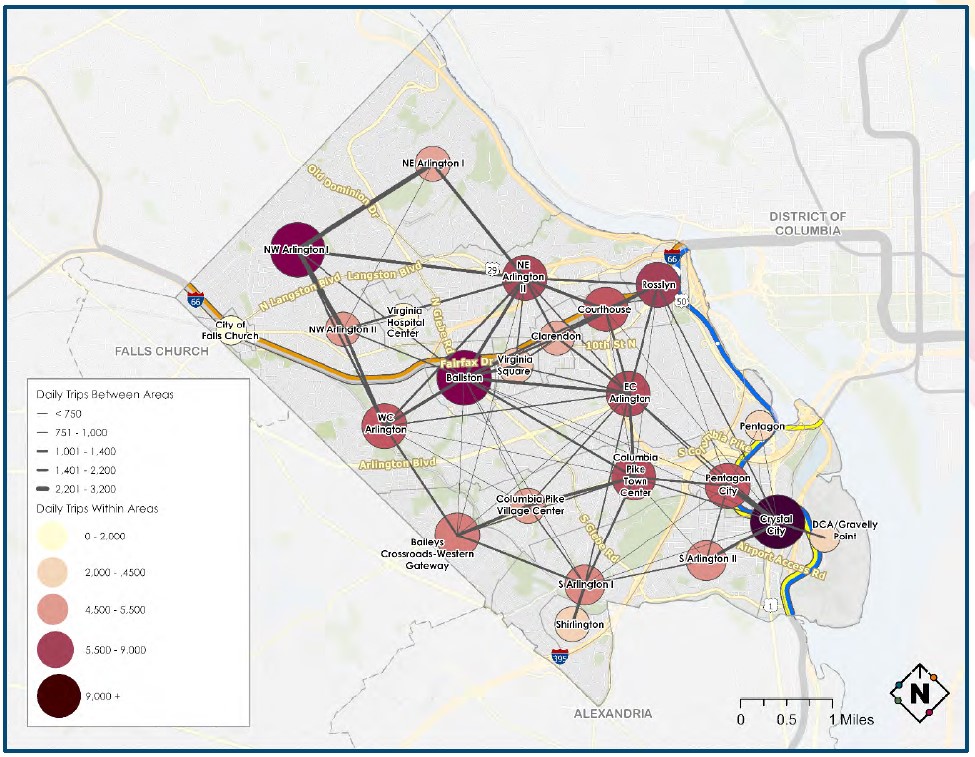
While driving alone is the most common travel mode both for trips to work and trips to other destinations, Arlington residents and commuters have large non-drive-alone mode shares as compared to the rest of the region and Virginia. Regarding the 23,000 people who both live and work in Arlington, insights about the locations of these trips can be seen in Figure 28, which presents data from Replica, a location-based data platform.64 The figure shows thicker straight lines representing higher volumes between zones, and yellow and orange circles representing higher volumes within a zone. Major inter-zone travel flows are seen following the Rosslyn-Ballston corridor, Columbia Pike to both Crystal City and Pentagon City, and the “NW Arlington 1” zone to more central areas of the County. The largest flows of intra-zonal travel are found in NW Arlington 1, Ballston, and Crystal City.
64 Source: Replica Spring 2021 data
Figure 28: Travel Patterns Within Arlington County
POPULATION AND EMPLOYMENT GROWTH
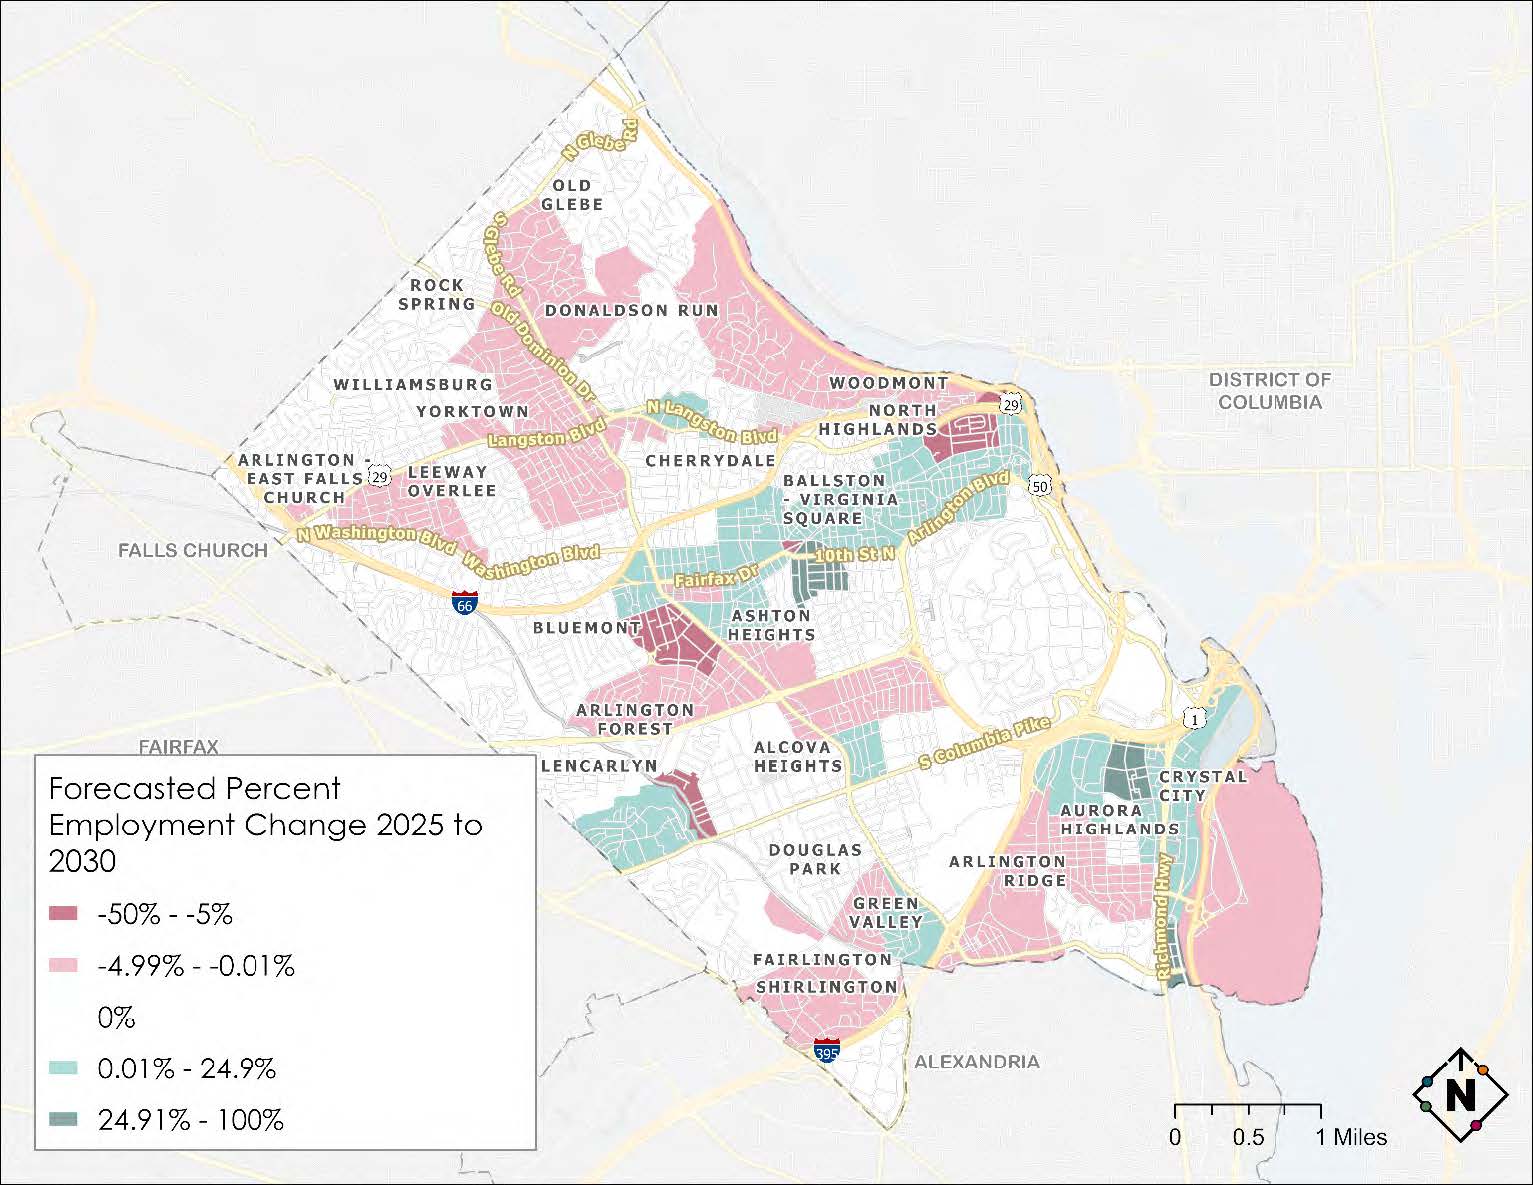
Based on the most recent regional forecasts from the Round 9.2 Cooperative Forecast model developed by the Metropolitan Washington Council of Governments (MWCOG), Arlington's population growth through 2030 will be concentrated in densely-populated areas including Rosslyn, Arlington Mill, Ballston-Virginia Square, Pentagon City, Crystal City, Clarendon- Courthouse, Bluemont, Columbia Heights, Arlington View, and Green Valley (Figure 29). Based on the same model, employment growth will be concentrated in the Rosslyn-Ballston corridor, Pentagon City, Crystal City, Green Valley, and Arlington Mill (Figure 30).65
While there is no way to predict the travel patterns of these new residents and know where the employees will be coming from, especially given the post-COVID introduction of non-traditional in-office requirements, these growth areas can be a place to focus on TDM outreach with the needs being generally accommodated by existing and planned transportation options.
65 Source: MWCOG Cooperative Forecast Round 9.2 (Round 10.0 is newer but is not available at the Transportation Analysis Zone, or TAZ, level) https://www.mwcog.org/documents/2023/11/03/cooperative-forecasts-employment-population-and- household-forecasts-by-transportation-analysis-zone-cooperative-forecast-demographics-housing- population/
Figure 29: Forecasted Population Growth 2025 to 2030
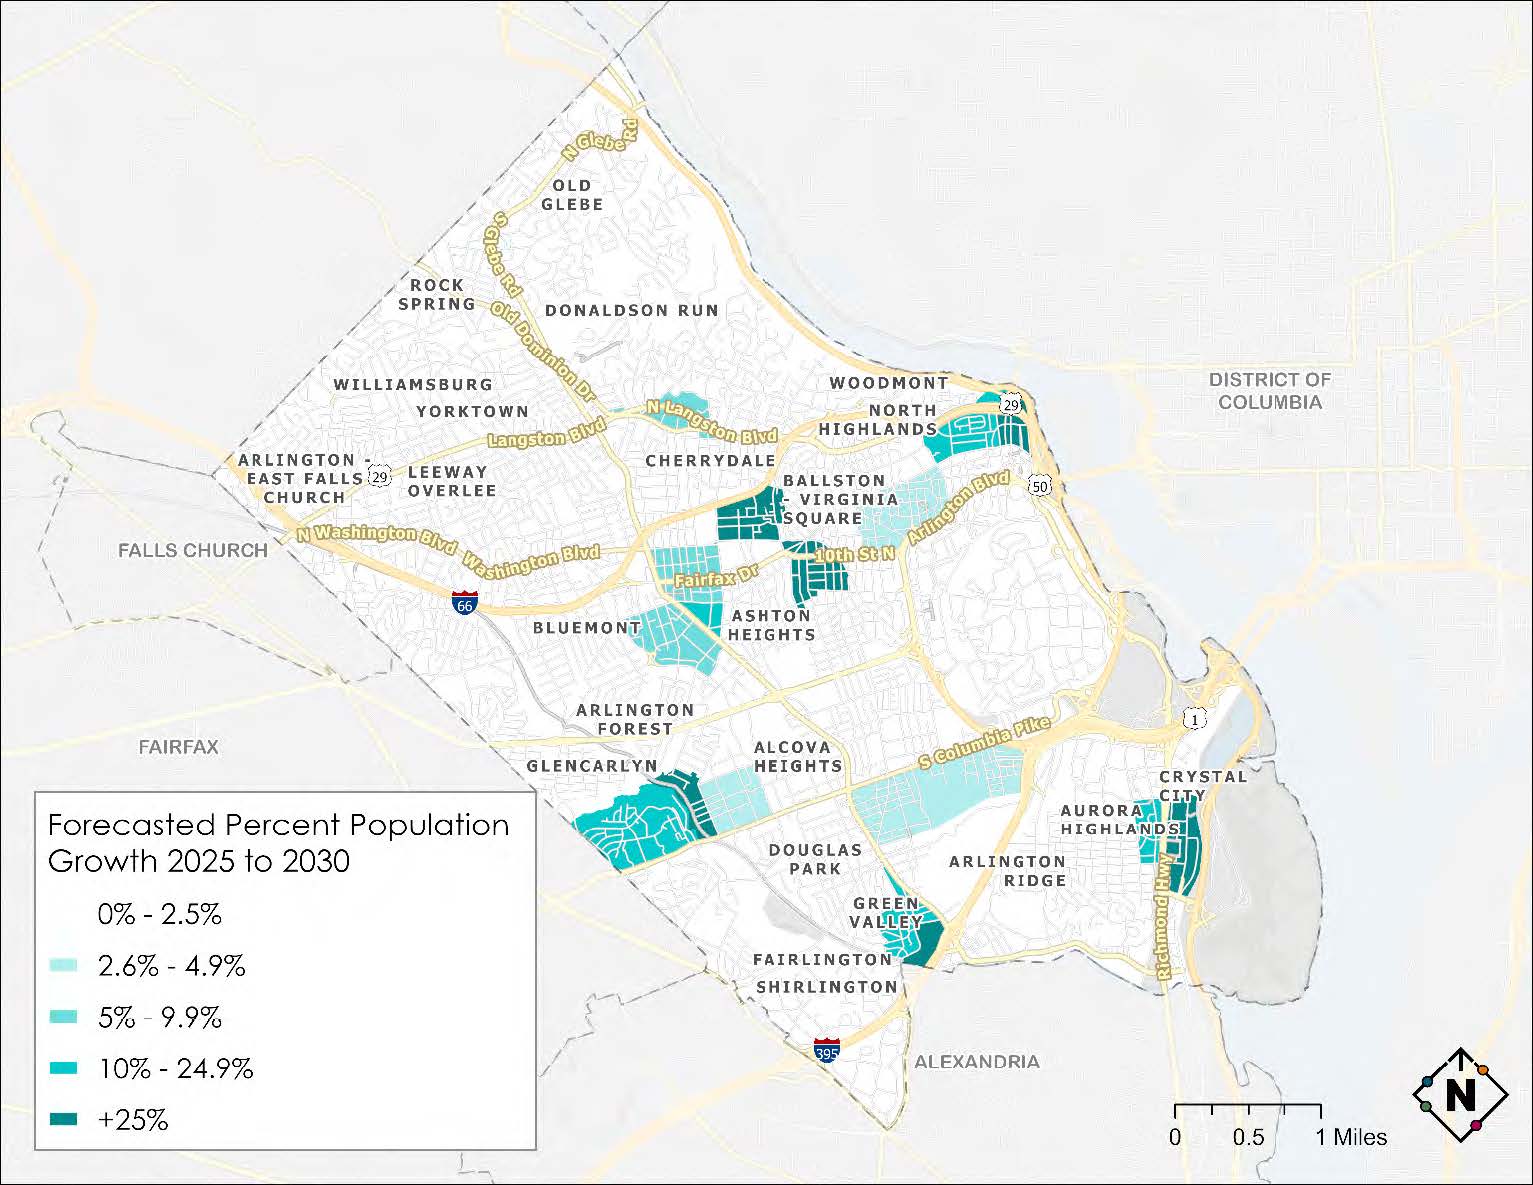
Figure 30: Forecasted Employment Growth 2025 to 2030
PLANNED TRAVEL OPTIONS
In addition to the existing transportation modes and services outlined in Chapter 2, the following Arlington Transit (ART) bus service recommendations were identified as part of the Arlington Transit Strategic Plan, approved by the County Board in November 2023:
-
Service improvements (including increased service, extended routes, consolidation of unproductive routes, new connections in equity-focused areas, and simplified patterns and service designations) to ART Routes 41, 42, 43, 45, 51, 52, 53, 55, 72, 74, 75, 77, 84, and 87.
-
Proposed new ART Route 54 (between Ballston Metro station and communities to the north that are slated to lose Route 72) and Route 85 (between Shirlington Transit Center and Potomac Yard Metro station by way of Crystal City).
-
Discontinuation of ART Route 61 (to be absorbed by Routes 51 and 53) and 62 (to be absorbed by Routes 52 and 53).
ACCS is already a key partner to ART in proactively communicating to Arlington residents, employees, and visitors about proposed transit services changes.
DEMOGRAPHIC TRENDS AND ECONOMIC DEVELOPMENT
As noted in Chapter 2, Arlington's population grew faster than the state of did during the 2010s. The County's population is expected to grow by approximately 11 percent between 2020 and 2030, after which growth is expected to slow to approximately eight percent. A County population of approximately 266,000 is projected by 2030, up from approximately 236,000 today.
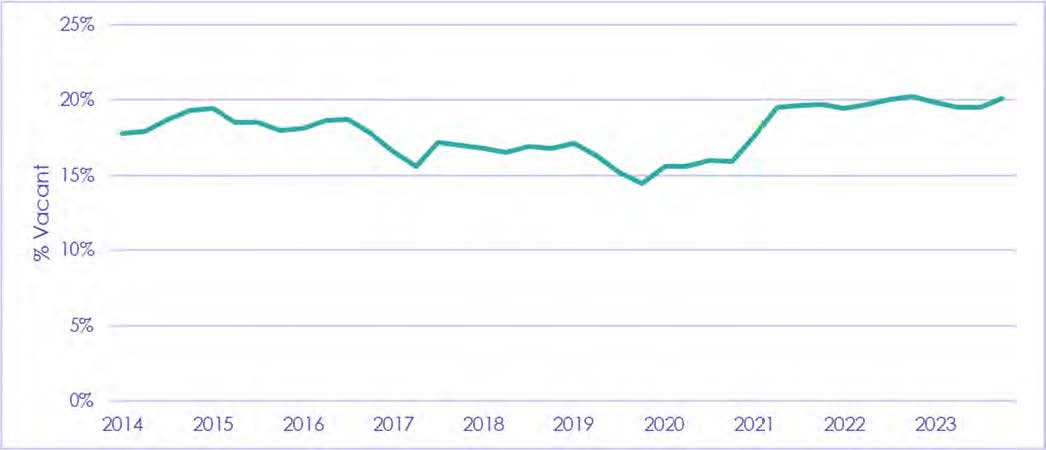
As shown in Figure 31, office vacancy rates across Arlington have risen in the wake of the COVID-19 pandemic, from approximately 15 percent in the fourth quarter of 2019 to approximately 22 percent in the third quarter of 2023, and seem to have plateaued since the fourth quarter of 2022. 66 It should be noted that while this was a large increase in vacancy rates over pre-pandemic levels between 2017 and 2020, vacancy rates between 2014 and 2016 were not much lower than they are currently (around 18-19 percent). While most submarkets of the County have vacancy rates near the 22 percent countywide rate as of the third quarter of 2023, there are some outliers, notably Crystal City, which is slightly higher at 25 percent, and North Arlington/East Falls Church with one percent (though this submarket has a comparatively low supply of office space).
Lower office occupancy rates are another indicator of fewer peak period work commute trips, traditionally a big part of ACCS's target market. While ACCS should continue to work with employers of office workers and commercial buildings that house these employers, it will need to target its messaging and outreach to this evolving reality, as well as coordinate with funding sources to facilitate the non-traditional use of funds for the promotion of non-commute travel.
Figure 31: Arlington County Office Vacancy
66 Source: CoStar. Downloaded 2/27/2024.
CHALLENGES FOR PROVISION OF COMMUTER ASSISTANCE PROGRAMS AND SERVICES
The post-pandemic world presents certain challenges for delivering commuter assistance programs and services. One of these is declining transit ridership and its effect on transit agencies' revenues, a trend seen both nationwide and in Arlington specifically. With declining fare revenues, transit agencies are faced with the prospect of reducing service to meet budgetary constraints. The resulting decline in transit service quality makes it more difficult to promote as a TDM measure.
The ACCS stakeholder engagement process outlined in Chapter 3 also identified several ACCS-specific challenges related to staffing, administration, and funding, as well as external changes such as hybrid work arrangements that make carpooling arrangements more difficult to establish and sustain.
This text-only version is offered as a more accessible alternative to this PDF document: Arlington County Commuter Services Transportation Demand Management Plan (PDF, 3.85 MB).
-